For: ETFuels Ltd
[December 2023 – February 2024]
studio Gear Up conducted a carbon footprint calculation for ETFuels to provide insights into the greenhouse gas emission performance resulting from the e-methanol production process and related savings. ETFuels is currently developing e-methanol production plants in Europe and the USA. Their ambition is to provide e-methanol at large scale to reduce the climate impact of the heavy industry and transport sectors.
ETFuels’ e-methanol projects connect off-grid renewable electricity generation to electrolysers to first produce hydrogen. Subsequently, renewable methanol is made by combining the green hydrogen with CO2 captured from various sources. The resulting methanol can then be transported to a range of customers such as shipping companies, traders or the chemical sector.
We calculated the carbon footprint of methanol of a foreseen USA installation following the guidelines of the Renewable Energy Directive (RED II). The resulting carbon footprint performance of ETFuels’ methanol was calculated to be 8.7 g CO2eq/MJ e-methanol. Compared to a fossil fuel reference, considerable greenhouse gas emissions savings are achieved, up to 90%. This is largely explained by the fact that renewable electricity is one of the main inputs for the methanol process. Most of the impact is related to the use of electricity from the grid during CO2 capturing and other processing activities. This implies that the performance can further improve when renewable electricity is also used for the CO2 capture and liquefaction earlier in the supply chain.
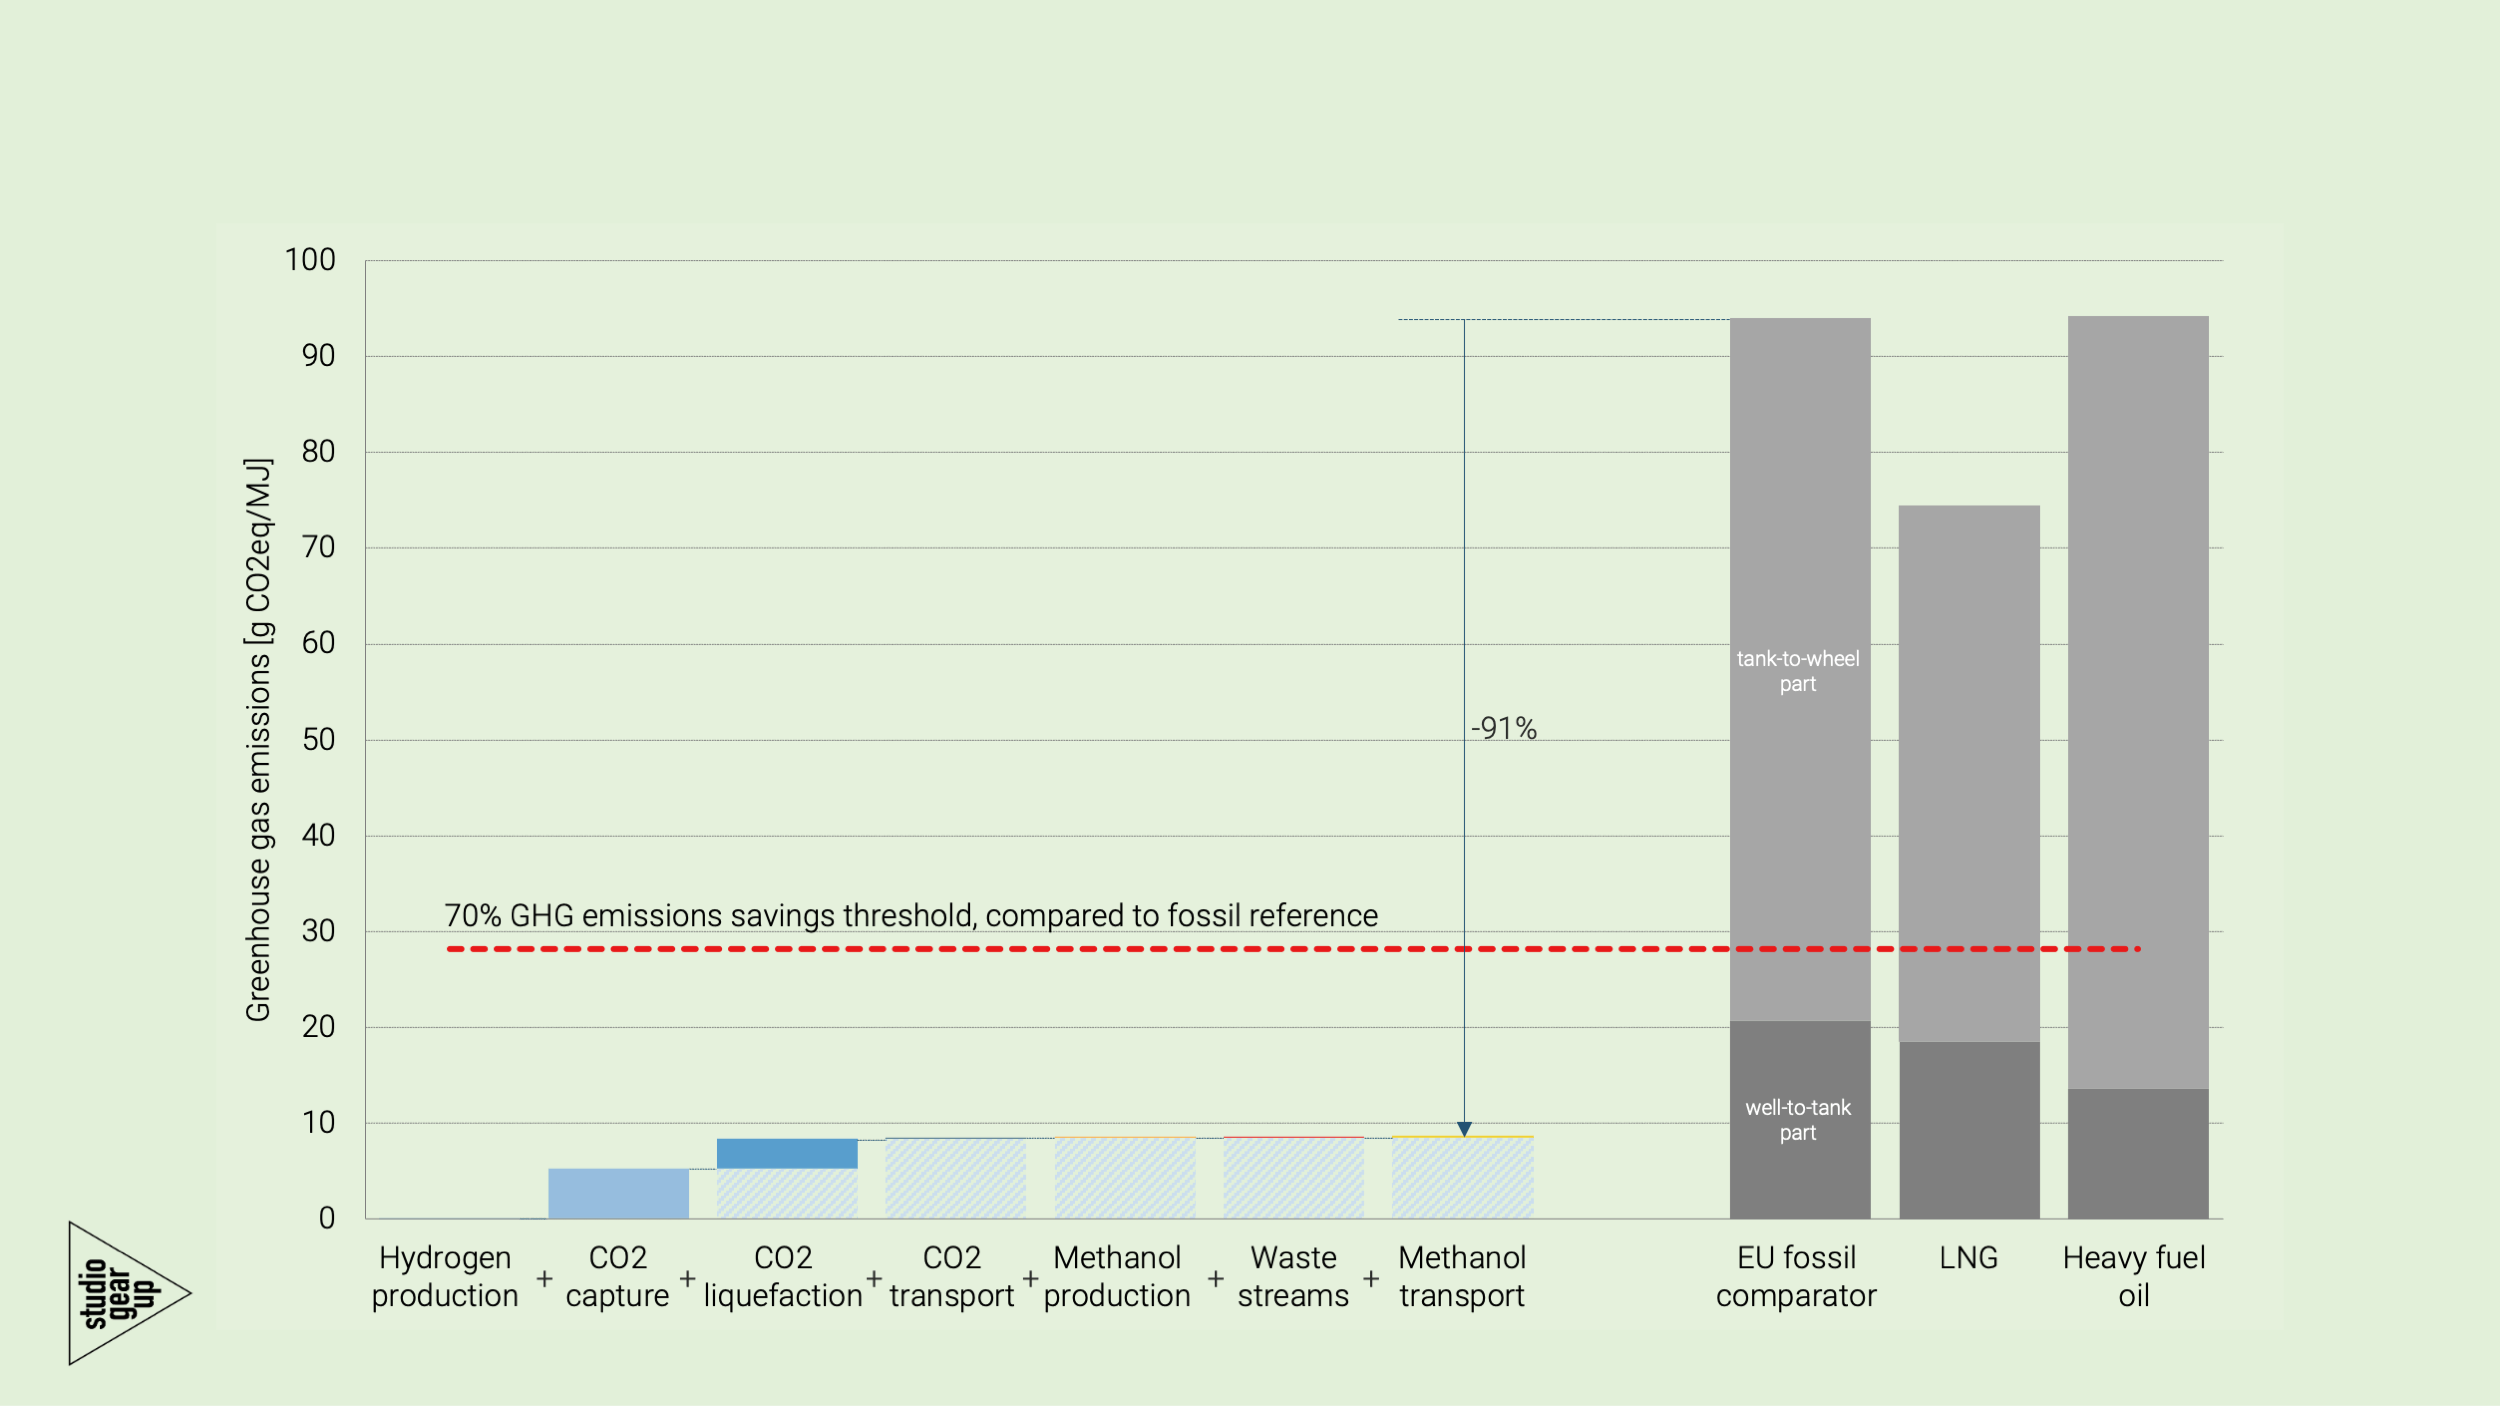
Carbon footprint of e-methanol by ETFuels, broken down into the main supply chain steps, and compared to fossil references such as the EU fossil comparator, LNG and heavy fuel oil. The results are expressed in g CO2eq/MJ.