Analysing the public data set of BP on the 2020 World Energy Statistics provides interesting insights.
The data set starts with information from the year 1965 and thus provides more than half a century of data on energy production and consumption from national level, continental level (e.g. European Union), up to World level.
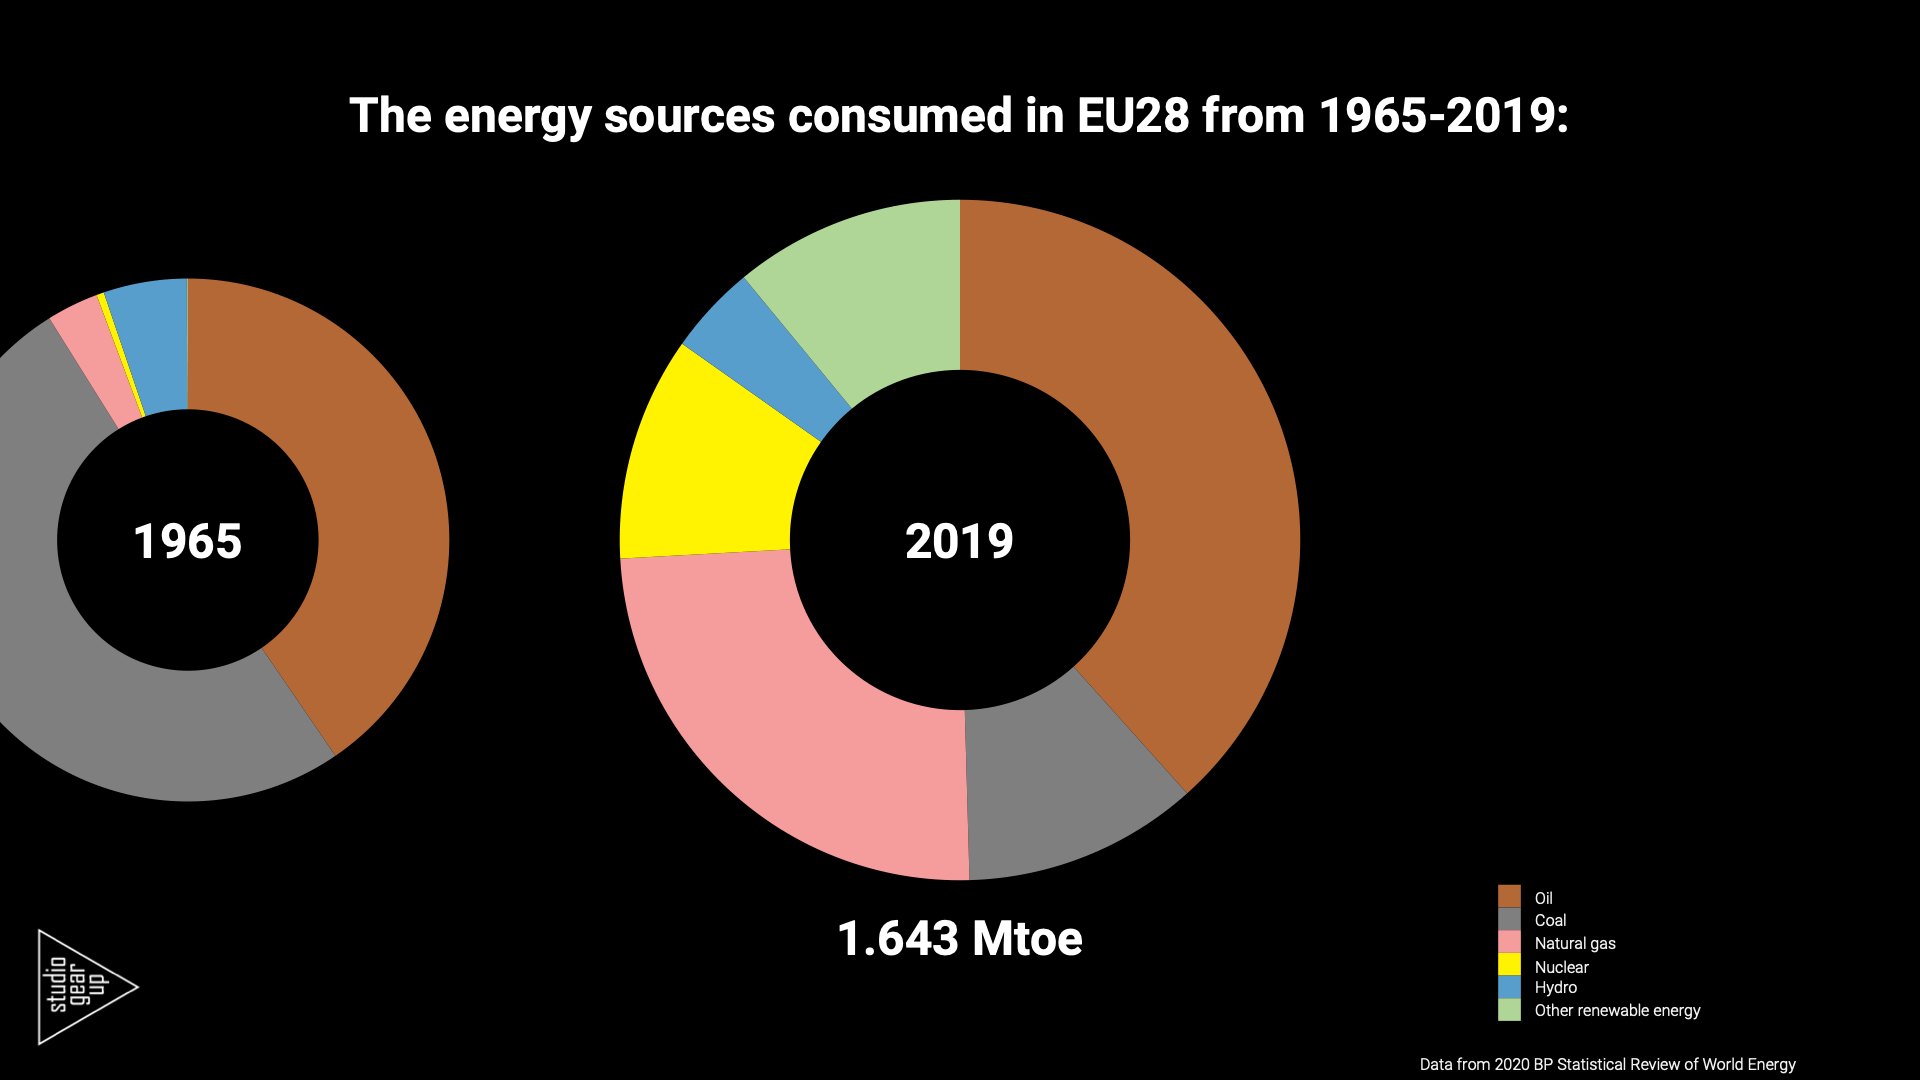
In this blog we have focused on the EU28s energy consumption of fossil oil, coal, natural gas, nuclear energy, hydropower and other renewable energy from the first year that the information is available in the data set, up to 2019.
Observations
- In 1965 the total primary energy consumption of EU28 amounted 1.005 Mtoe (42,1 EJ). By 2019 this has grown to 1.643 Mtoe (68,9 EJ). This is a growth factor of 1,63.
- Oil crises in the 1970s and early 1980 and the 2007 financial crisis only caused short and marginal dips in the ongoing growth of energy consumption.
- The share of coal (51% in 1965) gradually declined (to 11% in 2019) by the emergence of three subsequent waves of alternatives: firstly natural gas, secondly nuclear and thirdly the rise of renewables
- Remarkably the role of fossil oil stayed during this half century fairly untouched: in 1965 its share was 40% and in 2019 still 38%.
The video below shows how the energy consumption developed over time. Watch in particular how the share of fossil oil remains constant.
Conclusions
- In about half a century the carbon intensity in electricity and heat by replacement of coal has been reduced
- The actual volume-wise usage of fossil oil has increased over time, while its overall share in the total energy consumption in EU28 member states has hardly changed.
- It is urgent to take action to lower the dependency of fossil oil and get low-carbon alternatives in place at scale. This is in particular required in both the transport and the chemical sector.
Data used
Information was taken from the annually updated BP world energy statistics. Data sets can be found at the ‘downloads’ section of the BP site.