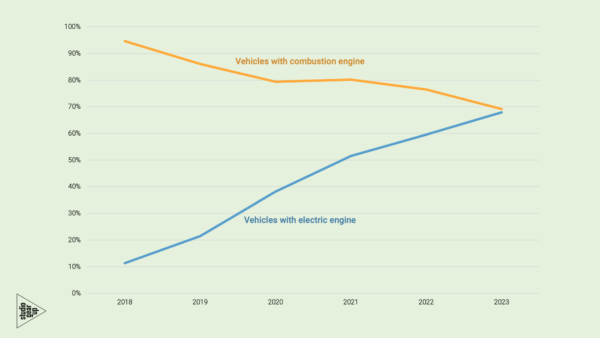
In 2020, the sales of new battery-electric passenger vehicles hit another record with over 71 thousand cars registered (20% of total passenger car registrations). Total battery electric vehicle (BEV) registration was 14,5% higher than the 2019 BEV sales.
Yet, this is not the only relevant trend. Due to the COVID-19 pandemic the annual sales of new passenger cars have dropped, from 450 thousand in 2019 to 360 thousand in 2020. Within that overall drop the sales of cars in the higher price ranges have been able to maintain sales volumes. In particular, the sales volumes of small and cheaper cars were hit hardest.
Furthermore, over the last three years another trend appears. The average base sales prices of the battery electric vehicles (BEVs) are coming down but at the same time the average base sales prices of internal combustion engine vehicles (ICEVs) are slowly rising. The decreasing new sales price of BEV can be explained by the focus in the fiscal support scheme.
The fiscal measures – directed to business related sales – do not lower the purchase price of a specific BEV model, but steer buyers to BEV models with lower sales price. At the same time, over the years, the top-10 ICEV models remain largely the same models while their base sales prices rise.
If this trend continues in the near future, this will put pressure on the affordability of automobility. Cheaper models will be taken from the market and be no longer be available. This will in particular impact citizens and households with smaller budgets.
On top of that, in the long run, this will also have a domino-effect on the used car market, as the smaller and cheaper cars in the future will not be available in that used car market if no longer sold in the new car market.
The new sales in the small car segment decreased
The development of new passenger car sales volumes (see Figure 1) in 2018, 2019 and 2020 clearly shows the overall 2020 drop in sales, compared to 2018 and 2019. The graph on the righthand side shows how in particular the sales of passenger cars in the lowest price classes, up to sales price of 20 thousand euro (k€) dropped. In 2018 nearly 200 thousand cars of the 440 thousand sold cars had a base price lower than 20 k€. In 2019 the sales number dropped by 50 thousand, to around 150 thousand total sales, and in 2020 it dropped another 50 thousand, to reach a total sales volume of just below 100 thousand, only half of the 2018 numbers. The cars in price range of 20-30 k€ also dropped in sales numbers, but the drop is with -12% in 2020 over 2018, not as strong.
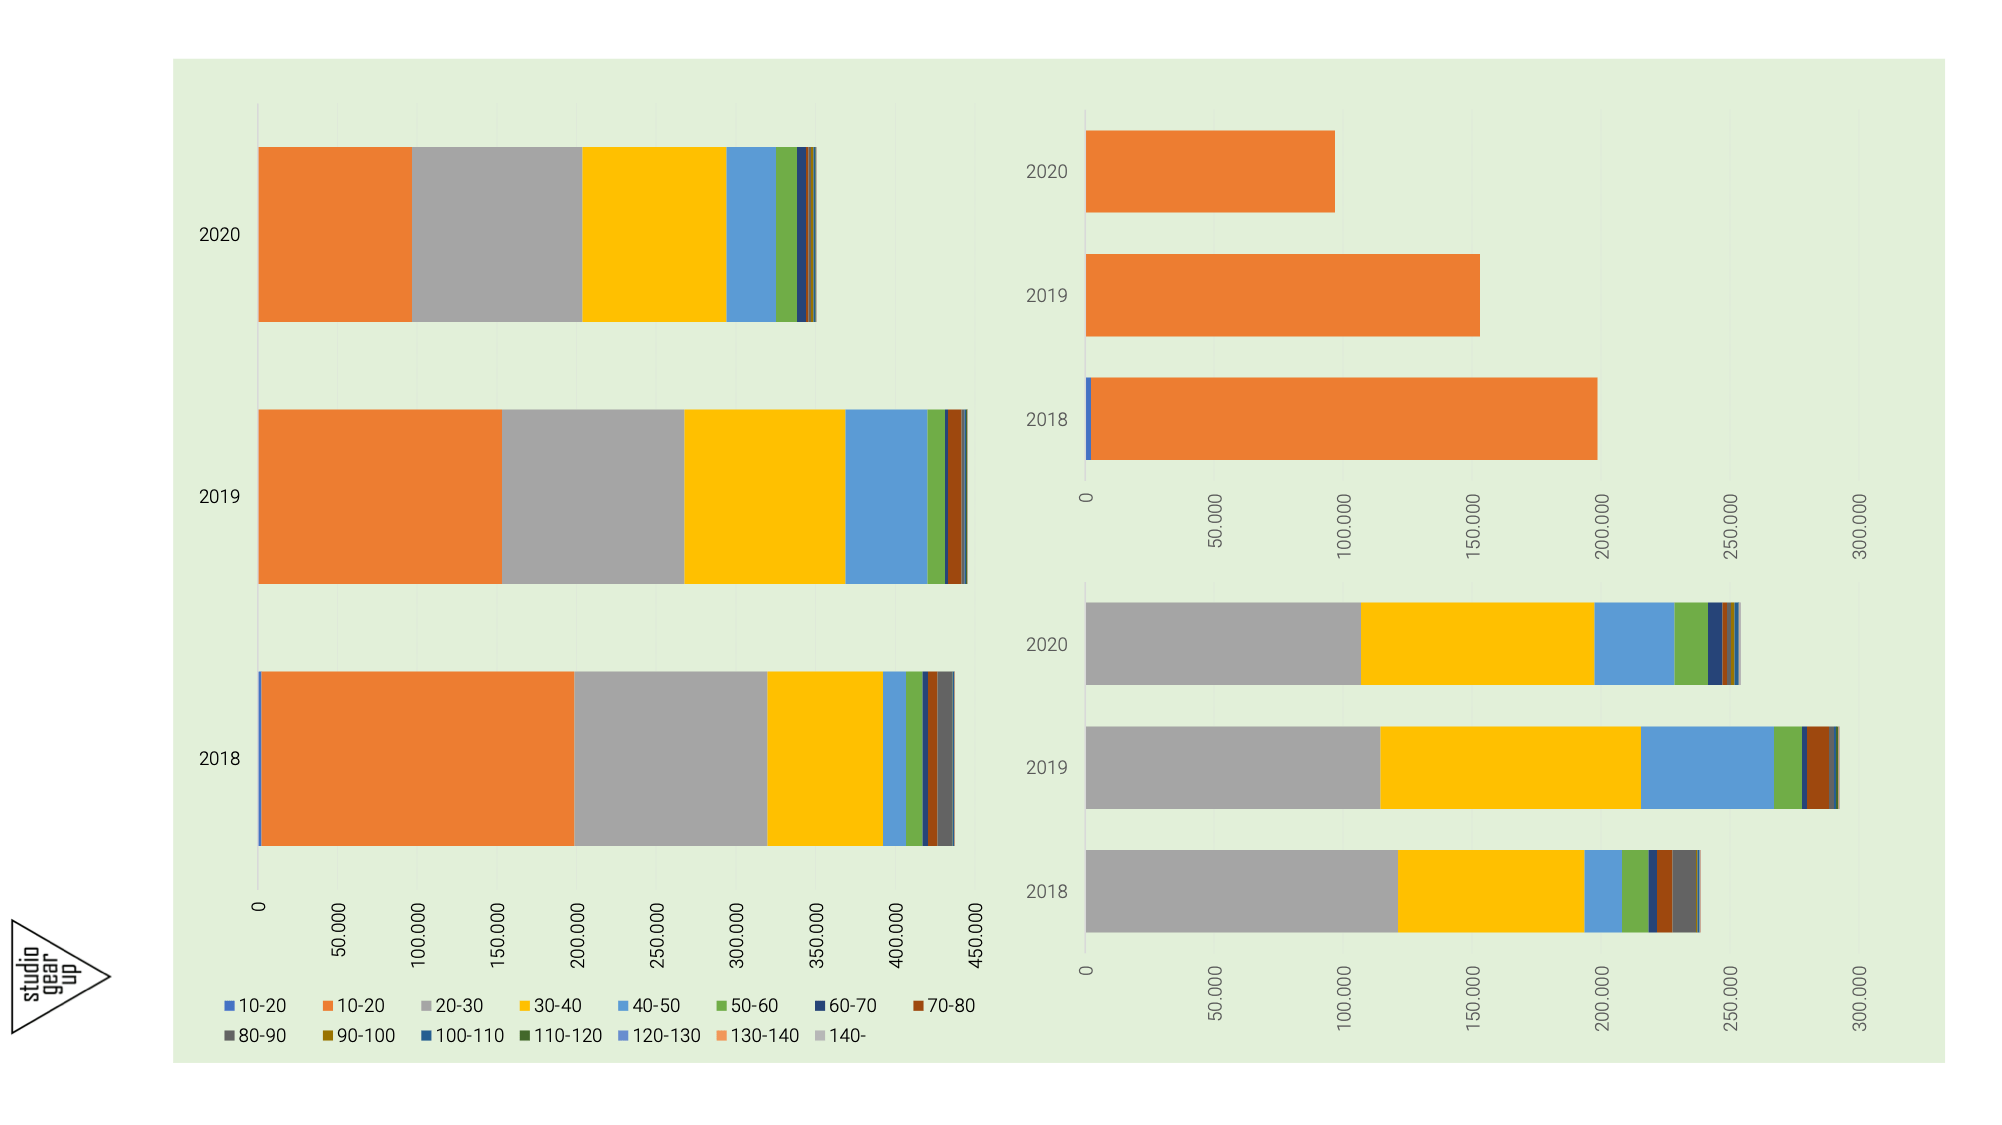
Remarkable is that in the segment with models in the price ranges above 30 k€ the sales volumes have remained more stable. The large sales numbers in 2019 in the 40-50 k€ range in 2019 are due to the success of Tesla’s Model 3: nearly 30 thousand sales (see the 2019 story here). This success was not repeated in 2020, due to further sobered fiscal support scheme in the Netherlands and the market entry of other battery electric competitors.
This development of decreased sales in the small and cheaper car segment becomes quite clear when presenting the number of sales of passenger cars for three years in a row, 2018, 2019 and 2020 (Figure 2). On the horizontal axis of the diagram all sold cars in a year are ranked from low sale price on the left to high sales price in the right end side of the graph. The vertical axis indicates the base sales price of the models. As already indicated in the previous Figure, the 20k€ sales price level is reached much earlier in the 2020 situation than it was in the case of 2018. In 2018 only the 200,000st model ticked the 20k€ level, whereas in 2020 that 200,000st model was a model with a base price of 30k€.This shows how in 2020 the sale of cars in the price range below 20k has slowed down significantly compared to the previous years.

Average base sales price of the top-10 most sold ICEVs have increased with 28,6%
Is affordability of new vehicles becoming an issue? For that it might be interesting to explore how the average base sales prices of most selling passenger cars, both ICEVs and BEVs, have developed over the last three years.
Due to the fact that in 2018 for the first time significant volumes of battery-electric vehicles sales appeared (> 5% of total passenger car sales, 24 thousands BEVs), a comparison over three years is possible. Figure 3 shows the average base price developments of the top-10 sold ICEVs (in blue) versus the top-10 sold BEVs (in orange) in each year.
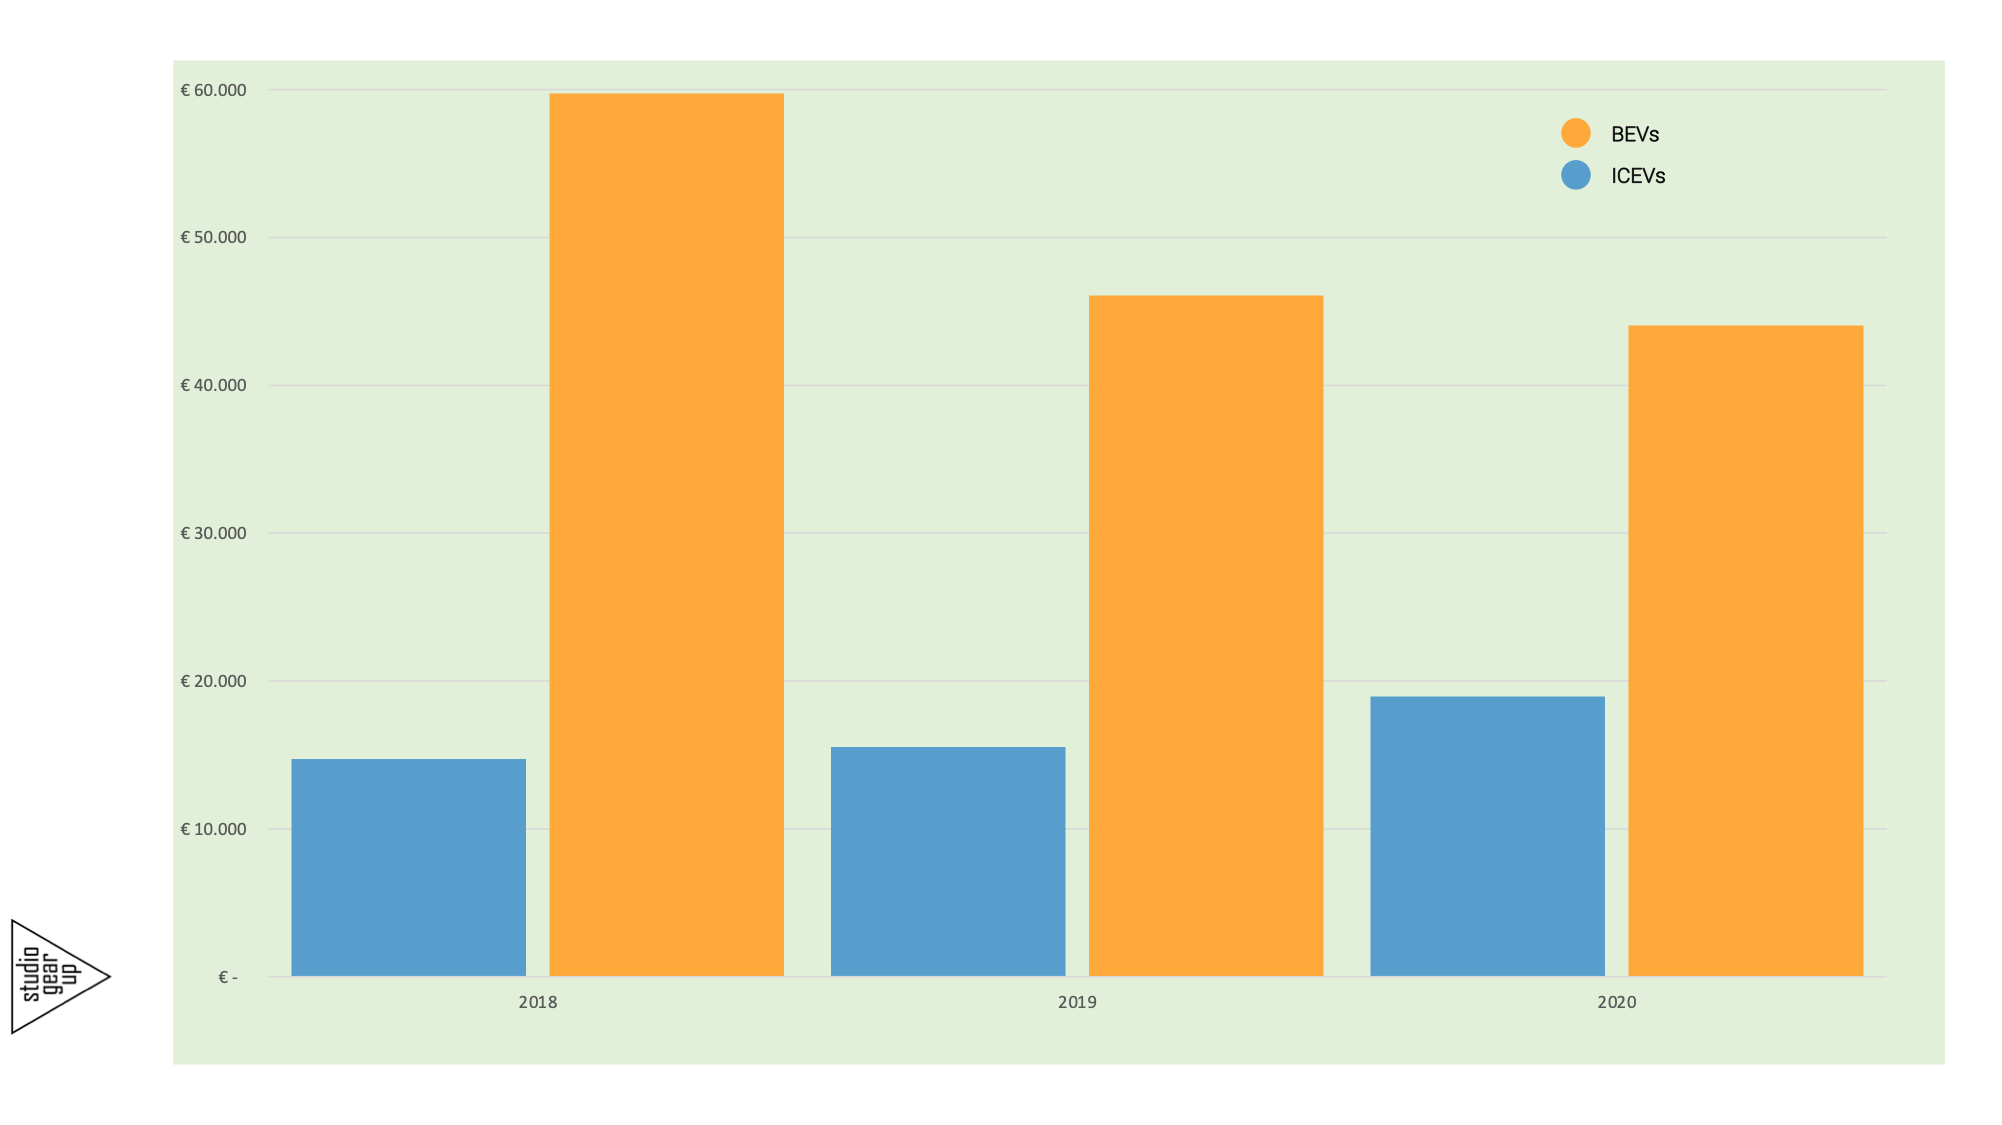
The base sales price of BEVs dropped significantly. In 2018 the fiscal support scheme was very attractive for business lease sales and generated significant sales of high-prized models, like Tesla’s Model S and Model X and Jaguar’s iPace. With the sobering of the scheme in 2019, capping the fiscal benefits above 50k€, and further reduction of the cap to 45k€ in 2020, these models no longer are sold at large volumes – other BEVs models have become more popular. Still the average base price of the top-10 sold BEV’s in 2020n is above 40k€ and needs to drop further down to reach competitive levels. The sobering of the fiscal support schemes will continue in the coming years and by 2026 the business lease conditions for BEVs will be equal to ICEVs. In that regard, the next years will be crucial to see whether BEV manufacturers will be able to meet buyer preferences and budgets. These preferences could well be expressed by the average base price of the top-10 sold ICEVs, which in 2020 was around 18,9k€, still 25k€ lower than the 2020 average price for the top 10 BEVs. Regarding affordability it can also be noted that the average price of top-10 ICEVs increased from 2018 to 2020 from 14,7k€ to 18,9k€, an increase of 28,6%.
The price gap between ICE and BEV models remains considerable
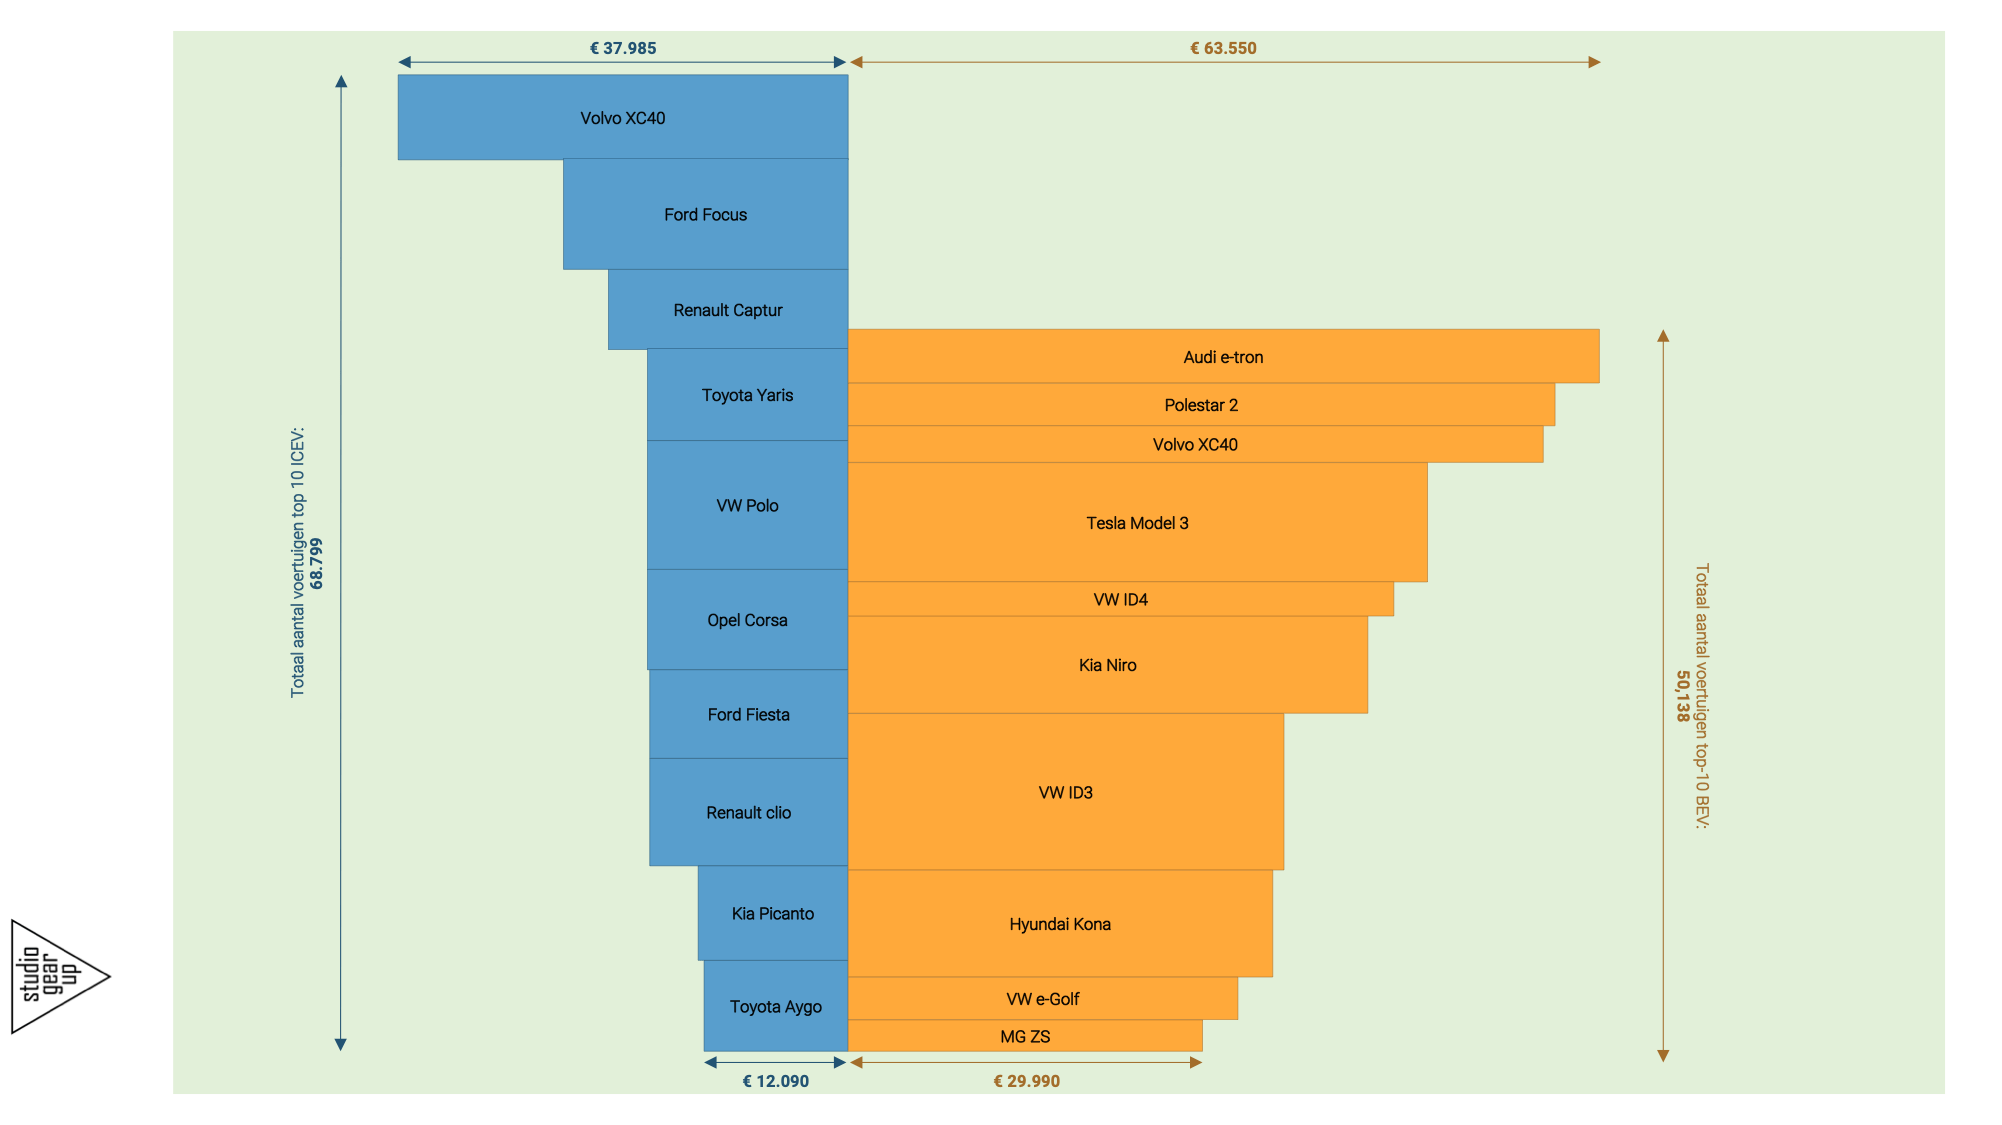
First it is important to note that in 2020 the top-10 ICEVs (69 thousand sales) represent a larger number of sales than the top-10 BEVs (50 thousand sales volume). The top-10 ICEVs represent 25% of all ICEVs sold in 2020, whereas the top-10 BEVs represent 70% of all BEVs sold. The base sales price of the ICEVs is significantly lower than that of the BEVs, except the Volvo XC40 ICEV model, which price wise would be no. 7 in the BEV top-10 list. On the other hand, the cheapest BEV model in the top-10 list, the MG ZS, is – besides the ICEV Volvo XC40 – more expensive than all ICEV models in the top list. The no.1 bestselling model among the BEVs is the VW ID3 with 10,954 sales. This model has a sales price of 36.9k€, which is 2,2 times more expensive than the no. 1 bestselling ICEV, the VW Polo, 16.9k€, with 8,975 sales. As the Volvo XC40 appears in both top-10 lists it is interesting to see its price difference: 38.0 k€ for the ICEV version versus 58.8 k€ for the BEV version
By the way, the best-selling model turned out to be the Kia Niro, due to 6,438 sales of its BEV-version and 5.442 sales of the ICEV version (total 11,880). Price difference of the two: 28,8 k€ for the ICEV; 44,0 k€ for the BEV version.
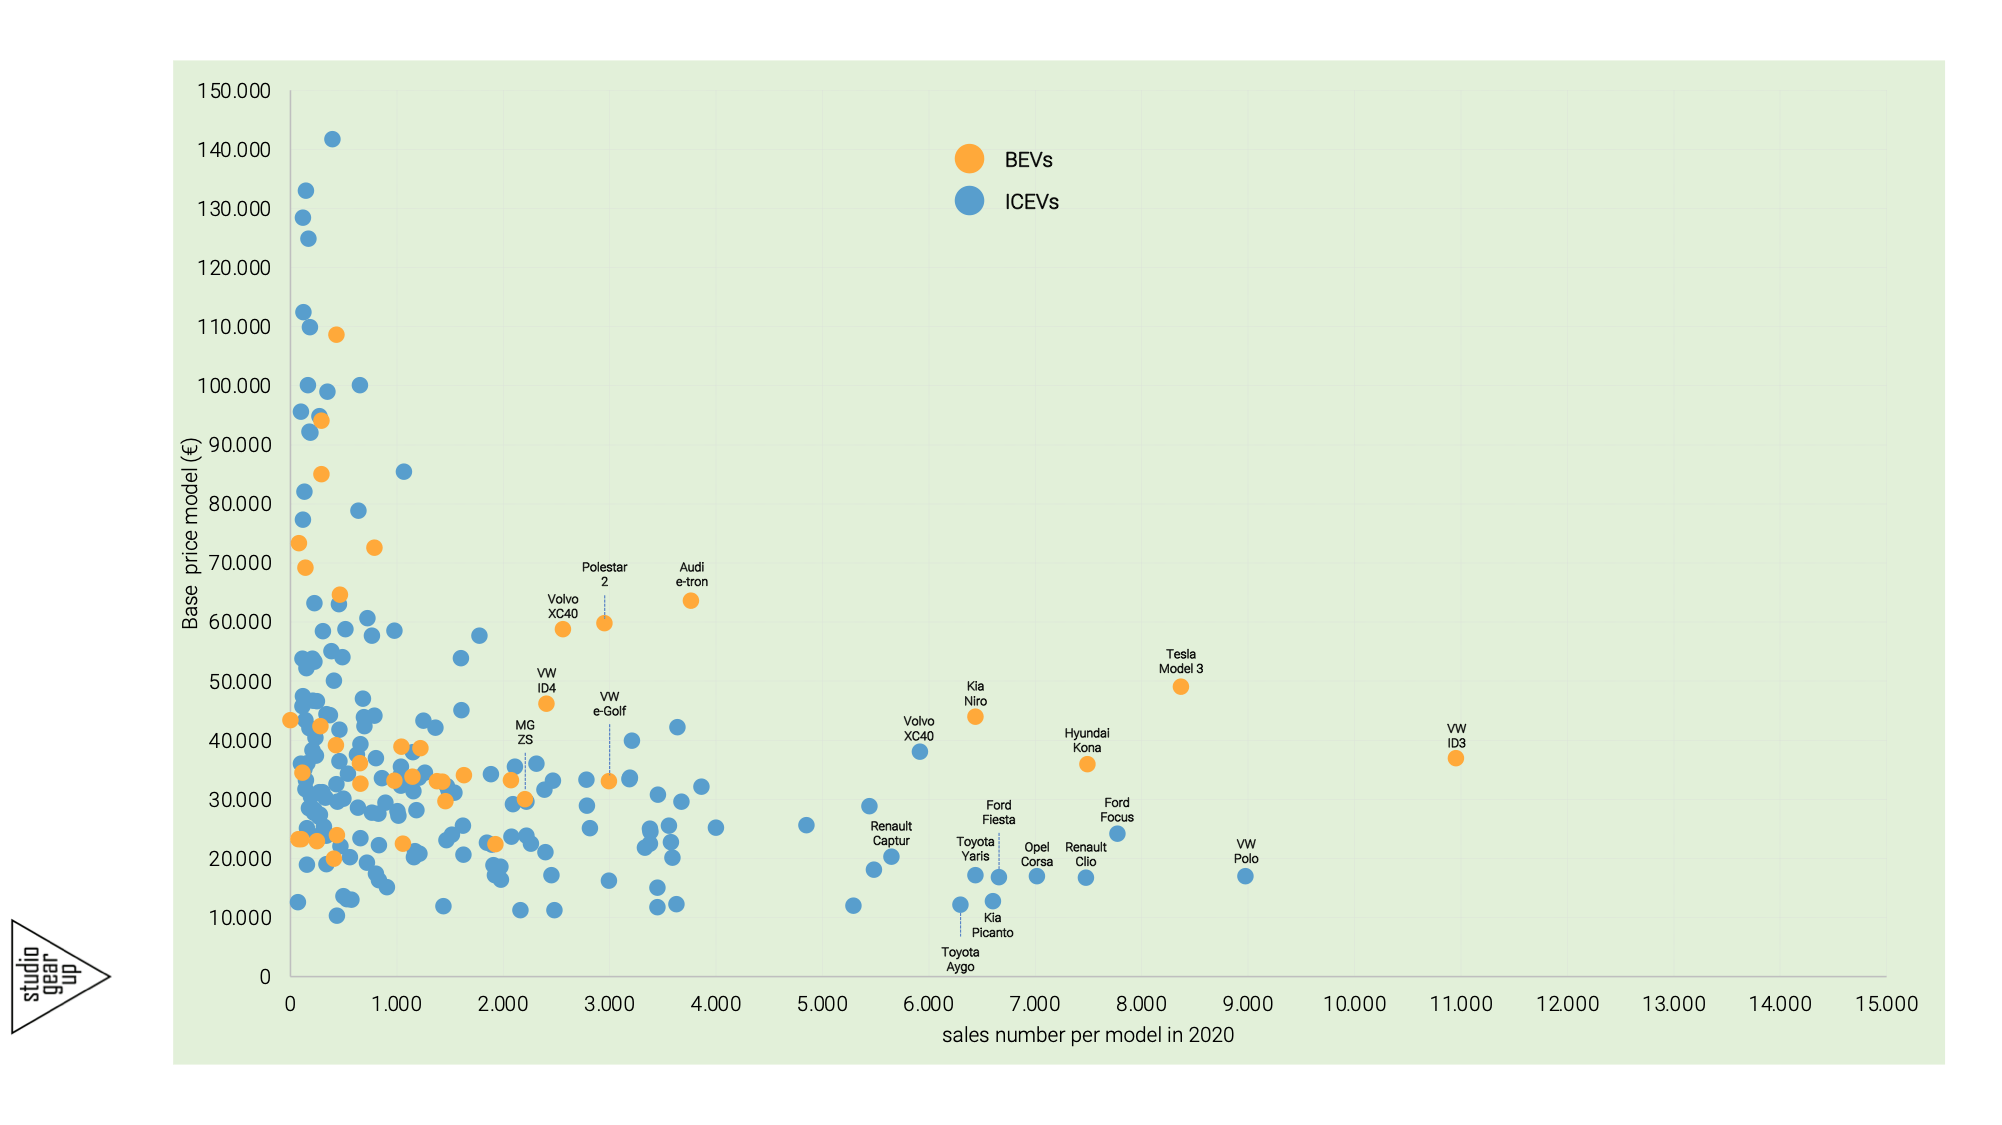
In general, it can be stated that vehicles with higher sales volumes are relatively low in purchase price, whereas very expensive models will often have limited sales numbers, reflecting their exclusiveness. The ICEV models (blue dots) could be viewed as flocking together under a ‘not-visible’ hyperbolic line. The top-10 sold ICEVs are shown in the diagram too. Most of the top-10 BEVs (orange dots) appear mostly in the higher areas of the graph. This indicated that their sales numbers are higher than what. would be expected on basis of just the sales price: the rule among the blue dots seems to be that higher prices result generally speaking in lower sales volumes. The higher sales volumes of the BEV models are caused by the higher fiscal instruments that are supporting the market uptake of BEVs.
studio Gear Up points out that in order to close the price gap between ICEVs and BEVs policy makers should consider to re-design their support instruments to favour those BEV models that are appearing in the 20-30k€ price range, or even in the 10-20k€ price range but yet show only low or moderate sales volumes. Such models are more in line with the purchase profile of current new car buyers and will offer a future portfolio of BEVs that come in reach for the used car market.
It requires also that BEV manufacturers start developing EV’s for this segment too, at lower prices than today’s prices.
Car sales analyses of other years:
2018
(in Dutch) Verkoop nieuwe personenauto’s en de klimaatopdracht
Notes
The information in this article is based on public information and data collected from BOVAG, RDW, RVO, Autoweek.nl/verkoopcijfers, Iserv.nl/files/electric